Overview
Code Climate Quality is being replaced with Qlty Cloud
— New users should sign up directly at qlty.sh.
— To migrate an existing account, please see our Migration Guide.
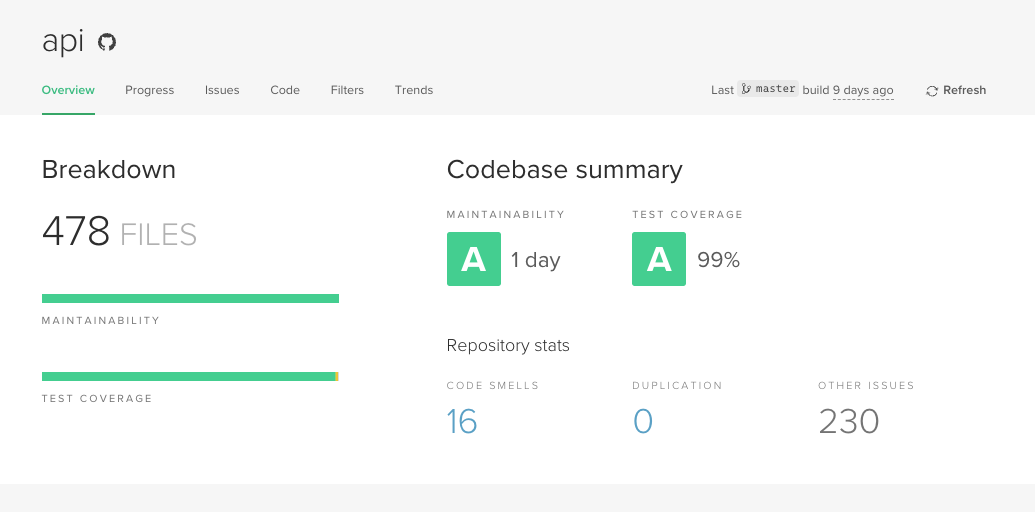
Breakdown
The Breakdown section of a repo's Overview page displays the number of files in the repo being analyzed by Quality.
- The Maintainability bar maps colors to letter grades. The amount of real-estate given to any given color indicates how prevalent the letter grade is in the repository.
- The Test Coverage bar visualizes the percentage of the repository's code which is covered by tests.
Codebase Summary
The Codebase Summary includes repo-level maintainability and test coverage ratings.
- Your maintainability rating is displayed as a letter grade, followed by the estimated remediation time for all maintainability issues Quality has identified.
- If you've set up test coverage reporting, we'll show your test coverage rating, followed by the overall percentage of your repo covered by tests.
Repository Stats
Your Repository stats show a breakdown of the number of issues we've identified in your repo:
- Code Smells
- Duplication
- Other Issues
Last build and Refresh Button
You can check to see when Quality last analyzed your repository by looking in the top-right corner.

Next to the last build time is the Refresh button, which enables you to manually trigger a new analysis. By default, Quality will build every new commit to your default branch. However, if you've changed your Quality configuration and want to see the new results without pushing a new commit, use the Refresh button. If you find yourself triggering an analysis manually on a regular basis, that may be sign that a deeper problem exists. To troubleshoot, we first recommend checking to make sure that our webhook is installed. If the problem persists, please contact support.
Updated 2 months ago